

Last Updated on 8 July 2026
Introduction
Technology has transformed the way people invest and trade in financial markets. What once required hours of manual research can now be automated using computer programs and data-driven models. This approach, known as Quantitative Trading Strategies, has become increasingly popular among hedge funds, proprietary trading firms, and even individual investors.
If you’ve ever wondered how professional traders use algorithms to identify trading opportunities, this guide is for you. In this beginner-friendly article, you’ll learn what quantitative trading is, how it works, and the foundational strategies used to analyze market data systematically.
Although quantitative trading may sound highly technical, the basic concepts are easier to understand than many people think. With the right knowledge, patience, and tools, beginners can start exploring quantitative strategies while understanding both their potential and their limitations.
Important: Quantitative trading involves financial risk. No strategy guarantees profits, and past performance does not predict future results. Always test any trading strategy thoroughly before using real money.
Why This Topic Matters
Financial markets generate enormous amounts of data every second. Prices, trading volume, volatility, interest rates, earnings reports, and economic indicators all influence investment decisions.
Human traders often struggle to process this information quickly, especially during periods of high market volatility. Quantitative trading helps solve this challenge by using mathematical models and computer algorithms to analyze data objectively.
As artificial intelligence, cloud computing, and accessible programming tools become more widespread, learning quantitative trading has become more achievable for retail investors. Even if you never build complex algorithms yourself, understanding the basics can improve how you evaluate trading strategies and manage risk.
What Is Quantitative Trading?

Quantitative trading is a method of buying and selling financial assets based on mathematical calculations, statistical analysis, and computer algorithms rather than subjective opinions or emotions.
Instead of asking:
“Does this stock look like a good investment?”
a quantitative trader asks:
“Does historical market data suggest this setup has a statistical edge?”
The strategy follows predefined rules. For example:
- Buy when a short-term moving average crosses above a long-term moving average.
- Sell when momentum weakens.
- Limit losses using predefined stop-loss levels.
- Risk only a fixed percentage of capital on each trade.
Because every rule is defined in advance, quantitative trading aims to remove emotional decision-making from the trading process.
A Simple Example
Imagine a trading rule that says:
- Buy a stock when its 20-day moving average rises above its 50-day moving average.
- Sell when the opposite crossover occurs.
- Risk no more than 2% of your account on a single trade.
A computer can scan hundreds or even thousands of stocks to identify these signals in seconds—something that would take a human much longer to do manually.
How Quantitative Trading Works
Every quantitative trading strategy follows a structured process.
Step 1: Collect Data
The first step is gathering historical and real-time market data, such as:
- Stock prices
- Trading volume
- Daily highs and lows
- Corporate earnings
- Interest rates
- Economic indicators
- Exchange rates
Reliable data is the foundation of any quantitative model.
Step 2: Build a Trading Hypothesis
The trader develops a hypothesis based on observable market behavior.
For example:
“Stocks showing strong momentum over the past six months may continue outperforming in the near future.”
This hypothesis is then translated into measurable rules.
Step 3: Create Trading Rules
Examples include:
- Buy when momentum exceeds a certain threshold.
- Sell after reaching a target return.
- Exit if losses exceed a predefined limit.
- Avoid trading during periods of unusually high volatility.
These rules remove guesswork from the decision-making process.
Step 4: Backtest the Strategy
Before risking real money, traders evaluate how the strategy would have performed using historical market data.
Backtesting helps answer questions such as:
- Would the strategy have generated positive returns?
- How often did it produce winning trades?
- What was the largest historical drawdown?
- How volatile were the results?
While useful, backtesting has limitations. Markets evolve, and historical success does not guarantee future performance.
Step 5: Execute Trades
Once a strategy has been tested, trades may be placed manually or automatically through trading software, depending on the trader’s experience and available tools.
Step 6: Monitor and Improve
Successful quantitative traders continually review performance because market behavior changes over time.
They may:
- Adjust parameters carefully.
- Improve risk controls.
- Remove ineffective rules.
- Test updated versions before implementation.
Continuous evaluation helps maintain a disciplined approach.
Core Components of Quantitative Trading
A successful quantitative strategy usually combines several key elements.
| Component | Purpose |
|---|---|
| Market Data | Provides historical and real-time information for analysis |
| Mathematical Models | Identify statistical patterns and trading opportunities |
| Programming | Automates calculations and trade execution |
| Risk Management | Helps control losses and protect capital |
| Backtesting | Evaluates historical performance before live trading |
| Execution System | Places trades according to predefined rules |
| Performance Analysis | Measures results and identifies areas for improvement |
Each component plays an important role in building a robust trading process.
Manual Trading vs Quantitative Trading
| Feature | Manual Trading | Quantitative Trading |
|---|---|---|
| Decision Making | Human judgment | Rule-based algorithms |
| Emotional Influence | High | Low |
| Speed | Slower | Very fast |
| Consistency | Can vary | Consistent execution |
| Number of Assets Monitored | Limited | Hundreds or thousands |
| Automation | Minimal | High |
| Scalability | Limited | Greater potential |
Neither approach is inherently superior. Many experienced investors combine quantitative analysis with fundamental research and sound risk management.
Types of Data Used in Quantitative Trading
Different strategies rely on different kinds of information.
Price Data
The most commonly used data includes:
- Opening price
- Closing price
- High
- Low
- Adjusted closing price
Volume Data
Trading volume helps measure market participation and liquidity.
Volatility Data
Volatility estimates how much prices fluctuate over time and can influence position sizing and risk management.
Fundamental Data
Some quantitative models incorporate financial metrics such as:
- Revenue growth
- Earnings per share (EPS)
- Profit margins
- Price-to-earnings (P/E) ratio
- Return on equity (ROE)
These factors can complement price-based signals.
Macroeconomic Data
Broader economic indicators may also be included, such as:
- Inflation rates
- Employment figures
- Gross Domestic Product (GDP)
- Central bank interest rates
- Consumer confidence indexes
Skills Needed to Learn Quantitative Trading
You don’t need a PhD in mathematics to begin learning quantitative trading, but certain skills can make the journey smoother.
Helpful areas include:
- Basic statistics
- Probability
- Spreadsheet analysis
- Logical thinking
- Risk management
- Financial market fundamentals
- Introductory programming (such as Python)
Many beginners start by understanding trading concepts before learning coding.
Is Quantitative Trading Suitable for Beginners?
Yes, but it’s important to approach it with realistic expectations.
Beginners should focus on learning the principles behind quantitative trading rather than chasing complex algorithms or unrealistic performance claims.
A sensible learning path might include:
- Understand market basics.
- Learn technical indicators.
- Study statistics and probability.
- Practice with historical data.
- Learn basic Python programming.
- Backtest simple strategies.
- Use paper trading before investing real money.
Taking a gradual, disciplined approach helps build a stronger foundation and reduces the likelihood of costly mistakes.
10 Quantitative Trading Strategies for Beginners
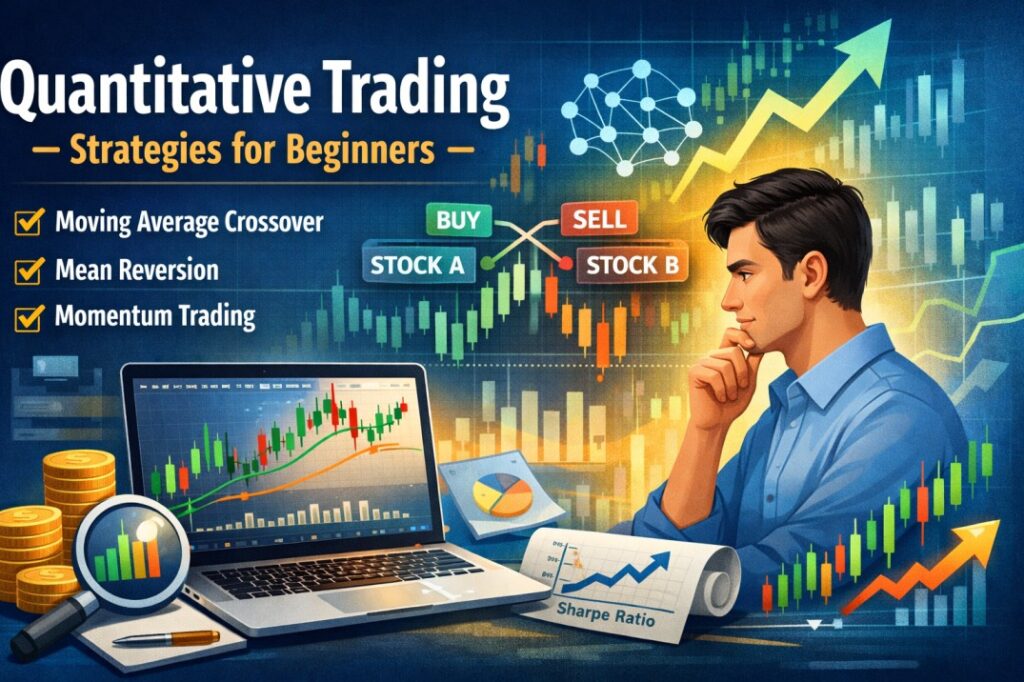
Once you understand the basics of quantitative trading, the next step is learning how different strategies work. Each strategy uses predefined rules to identify potential trading opportunities based on historical price movements, market behavior, or statistical relationships.
It’s important to remember that no quantitative trading strategy works all the time. Market conditions change, and even well-tested systems can experience losing periods. That’s why professional traders focus on risk management as much as strategy development.
1. Moving Average Crossover Strategy
The Moving Average Crossover is one of the simplest quantitative trading strategies and is often the first strategy beginners learn.
A moving average smooths price data by calculating the average price over a specific period.
A common setup is:
- Buy when the 50-day Moving Average crosses above the 200-day Moving Average (often called a Golden Cross).
- Sell when the 50-day Moving Average falls below the 200-day Moving Average (known as a Death Cross).
Example
Suppose a stock has been rising steadily for several months. As the shorter-term moving average climbs above the longer-term average, the strategy generates a buy signal. The position is held until the trend weakens and the averages cross in the opposite direction.
Advantages
- Easy to understand
- Works well in trending markets
- Removes emotional decision-making
- Widely used and well documented
Limitations
- Can produce false signals during sideways markets
- Signals often lag because moving averages rely on historical prices
2. Mean Reversion Strategy
Mean reversion is based on the idea that prices tend to return toward their historical average after making unusually large moves.
The strategy assumes that extreme price movements may eventually reverse.
Example
Imagine a stock that usually trades between $95 and $105 but suddenly drops to $88 after a temporary overreaction to news. A mean reversion model may identify this as a potential buying opportunity if other risk filters are satisfied.
Best Used In
- Range-bound markets
- Stable market conditions
Risks
- Prices may continue moving away from the average.
- Strong trends can make this strategy ineffective.
3. Momentum Trading Strategy
Momentum investing assumes that assets performing well recently may continue performing well for a period of time.
Instead of buying “cheap” assets, momentum traders buy assets showing strong upward price movement.
Typical Rules
- Buy stocks making new highs.
- Exit when momentum weakens.
- Use stop-loss orders to control downside risk.
Example
A technology stock has gained 25% over the past three months while trading volume continues increasing. A momentum model may identify it as a candidate for further analysis.
Momentum strategies can perform well during strong bull markets but may struggle when trends reverse quickly.
4. Breakout Strategy
Breakout trading attempts to capture significant price movements when an asset moves above resistance or below support levels.
Buy Signal
Price breaks above previous resistance with higher-than-average trading volume.
Sell Signal
Price falls below support or reaches a predefined exit condition.
Example
Suppose a stock has traded between $48 and $50 for several weeks. If it closes above $50 with unusually high volume, a breakout strategy may initiate a trade.
Advantages
- Can capture strong trends early.
- Objective entry and exit rules.
Risks
- False breakouts are common.
- Volatile markets may trigger unnecessary trades.
5. Trend Following Strategy
Trend-following strategies aim to stay invested while a trend remains intact.
The guiding principle is simple:
“The trend is your friend—until it ends.”
Rather than predicting market turning points, trend followers react to existing price movements.
Indicators Often Used
- Moving averages
- Average Directional Index (ADX)
- Price channels
- Trendlines
Suitable For
- Stock markets
- Commodities
- Forex
- Exchange-Traded Funds (ETFs)
Trend following often requires patience because trends can take weeks or months to develop.
6. Statistical Arbitrage
Statistical arbitrage (Stat Arb) identifies temporary pricing inefficiencies between related securities.
This strategy is more advanced than the previous ones and typically requires programming skills, statistical modeling, and fast execution.
Example
Suppose two companies in the same industry usually move together. If one temporarily falls significantly while the other remains stable, the model may expect prices to converge again.
Professional quantitative trading firms commonly use this approach, but it can be challenging for beginners due to its complexity and technology requirements.
7. Pairs Trading
Pairs trading is a market-neutral strategy that involves trading two historically correlated assets.
The goal is to profit if the price relationship returns to its normal range.
Example
If two airline stocks usually move similarly but one suddenly underperforms without a clear fundamental reason, a pairs trading strategy might:
- Buy the weaker stock.
- Sell the stronger stock.
The trade is closed if the price relationship normalizes.
Advantages
- Less dependent on overall market direction.
- Can reduce market exposure.
Risks
- Historical relationships may break down.
- Requires careful statistical analysis.
8. Volatility Trading
Volatility measures how much prices fluctuate over time.
Some quantitative strategies focus more on expected volatility than on price direction.
Common Indicators
- Historical volatility
- Average True Range (ATR)
- Volatility Index (VIX)
- Implied volatility from options markets
Higher volatility often increases both potential returns and potential losses.
Because of its complexity, beginners should first understand basic risk management before exploring volatility-based systems.
9. Volume-Based Trading Strategy
Trading volume reflects the level of market participation.
Many quantitative systems combine price action with volume confirmation.
Example
Instead of buying every breakout, a trader might only buy if:
- Price breaks above resistance.
- Trading volume is at least 40% above its recent average.
This additional filter helps reduce false signals.
10. Machine Learning-Based Trading
Machine learning is becoming increasingly popular in quantitative finance.
Instead of manually defining every trading rule, machine learning models identify patterns from historical data.
Applications include:
- Price forecasting
- Risk estimation
- Portfolio optimization
- Fraud detection
- Sentiment analysis
While fascinating, machine learning is not recommended as a starting point. Beginners should first master traditional quantitative strategies before exploring artificial intelligence techniques.
Comparison of Popular Quantitative Trading Strategies
| Strategy | Difficulty | Suitable for Beginners | Best Market Condition |
|---|---|---|---|
| Moving Average Crossover | Easy | ✅ Yes | Trending |
| Mean Reversion | Easy | ✅ Yes | Sideways |
| Momentum Trading | Medium | ✅ Yes | Strong Trends |
| Breakout Trading | Medium | ✅ Yes | High Volatility |
| Trend Following | Easy | ✅ Yes | Trending |
| Statistical Arbitrage | Advanced | ❌ No | Institutional |
| Pairs Trading | Medium | Limited | Market Neutral |
| Volatility Trading | Medium | Limited | Volatile Markets |
| Volume Analysis | Easy | ✅ Yes | All Markets |
| Machine Learning | Advanced | ❌ No | Large Data Sets |
Benefits of Quantitative Trading
Quantitative trading offers several advantages over purely discretionary trading.
Removes Emotional Bias
Fear and greed often influence investment decisions. Rule-based systems help traders follow predefined plans rather than reacting emotionally.
Consistent Decision-Making
Every trade follows the same rules, improving discipline and reducing inconsistency.
Faster Analysis
Computers can evaluate thousands of securities in seconds, making it possible to identify opportunities that would be difficult to find manually.
Backtesting Capability
Historical testing allows traders to evaluate strategies before risking real capital.
Scalability
A single algorithm can monitor multiple markets and instruments simultaneously, making quantitative trading highly scalable.
Risks of Quantitative Trading
Despite its advantages, quantitative trading has meaningful risks.
Overfitting
A strategy may perform exceptionally well on historical data simply because it has been overly optimized, but fail in live markets.
Data Quality Issues
Poor-quality or incomplete data can produce misleading results.
Market Regime Changes
Strategies that worked during one market environment may underperform when conditions change.
Technology Risk
Software bugs, internet outages, or execution delays can affect trading performance.
False Confidence
Backtesting can create unrealistic expectations if transaction costs, slippage, and changing market conditions are ignored.
Pros and Cons
| Pros | Cons |
|---|---|
| Objective decision-making | Requires continuous testing |
| Reduces emotional trading | Can be technically challenging |
| Suitable for automation | Strategies can stop working |
| Enables historical testing | Data quality is critical |
| Can monitor multiple assets | Technology failures can occur |
Who Should Consider Quantitative Trading?
Quantitative trading may be suitable for:
- Beginners interested in data-driven investing.
- Investors who enjoy statistics and logical problem-solving.
- Traders willing to learn programming over time.
- Individuals comfortable following predefined rules.
- People interested in automation and systematic investing.
Who May Want to Avoid It?
This approach may not be ideal for:
- Investors seeking quick profits with little effort.
- People unwilling to learn new concepts.
- Traders who rely entirely on intuition.
- Individuals who cannot tolerate periods of underperformance.
- Anyone expecting a strategy to work indefinitely without updates.
Common Mistakes Beginners Make
Many new traders repeat the same errors when starting with quantitative strategies.
Believing Backtests Guarantee Future Results
Historical performance is informative but never guarantees future success.
Ignoring Risk Management
Even profitable strategies can experience significant losses. Position sizing and stop-loss rules are essential.
Using Too Many Indicators
Adding excessive indicators often increases complexity without improving results.
Frequently Changing Strategies
Constantly switching systems makes it difficult to evaluate performance objectively.
Overleveraging
Borrowing too much capital can amplify losses just as easily as gains.
Skipping Paper Trading
Testing a strategy in a simulated environment can reveal weaknesses before real money is at risk.
Practical Example: Building a Simple Rule-Based Strategy
Suppose you want to trade a broad-market ETF using a straightforward trend-following approach.
Your rules could be:
- Buy when the 50-day moving average rises above the 200-day moving average.
- Sell when the 50-day moving average falls below the 200-day moving average.
- Risk no more than 1% of your portfolio on any single trade.
- Review the strategy’s performance monthly rather than reacting to daily price fluctuations.
This example illustrates how quantitative trading emphasizes discipline, predefined rules, and consistency rather than predictions or emotions.
Best Quantitative Trading Tools for Beginners
One of the biggest advantages of quantitative trading today is that you don’t need to build everything from scratch. Many platforms provide historical market data, charting tools, backtesting features, and even automated trading capabilities.
As a beginner, focus on learning the concepts before investing in expensive software.
1. Python
Python is the most widely used programming language in quantitative finance because it is beginner-friendly and has a large ecosystem of financial libraries.
Popular libraries include:
- Pandas – Data analysis and manipulation
- NumPy – Mathematical calculations
- Matplotlib – Data visualization
- SciPy – Statistical analysis
- Backtrader – Strategy development and backtesting
- VectorBT – Portfolio and strategy analysis
Python is free to learn and is supported by thousands of tutorials and online communities.
2. Microsoft Excel
Many successful traders begin by testing simple trading ideas in Excel before writing code.
Excel can help you:
- Calculate moving averages
- Analyze historical returns
- Build simple trading models
- Track portfolio performance
- Understand statistical concepts
While Excel has limitations for large datasets, it remains an excellent learning tool.
3. TradingView
TradingView is one of the most popular charting platforms among retail traders.
Features include:
- Interactive charts
- Technical indicators
- Strategy testing
- Price alerts
- Community-created indicators
- Pine Script programming language
Its intuitive interface makes it suitable for beginners who want to visualize trading ideas.
4. MetaTrader
MetaTrader is widely used in forex and CFD markets.
It offers:
- Automated trading
- Strategy testing
- Custom indicators
- Expert Advisors (EAs)
- Historical data analysis
Although it is more common among forex traders, the concepts are applicable to systematic trading in general.
5. QuantConnect
QuantConnect is a cloud-based platform designed for quantitative strategy development.
It supports:
- Python and C#
- Historical market data
- Multi-asset backtesting
- Algorithm optimization
- Paper trading
It is often recommended for learners who want to transition from basic scripting to more advanced quantitative research.
6. Interactive Brokers API
Many professional and experienced retail traders use brokerage APIs to automate trade execution.
These APIs allow developers to:
- Retrieve live market data
- Place orders programmatically
- Monitor positions
- Build custom trading systems
Automation should only be considered after thoroughly understanding trading mechanics and risk management.
Comparison of Popular Quantitative Trading Tools
| Tool | Best For | Beginner Friendly | Cost |
|---|---|---|---|
| Python | Strategy development | ✅ Yes | Free |
| Excel | Learning & calculations | ✅ Yes | Paid/Included with Microsoft 365 |
| TradingView | Chart analysis | ✅ Yes | Free & Premium Plans |
| MetaTrader | Forex automation | Moderate | Free |
| QuantConnect | Algorithm development | Moderate | Free & Paid Plans |
| Brokerage APIs | Automation | Advanced | Depends on broker |
Why Backtesting Is Essential
One of the defining features of quantitative trading is the ability to test ideas before risking real money.
This process is known as backtesting.
Backtesting evaluates how a trading strategy would have performed using historical market data.
Rather than relying on intuition, traders can analyze objective performance metrics.
Questions Backtesting Can Help Answer
- Would this strategy have been profitable historically?
- How many winning trades did it generate?
- What was the average return per trade?
- How large were the losses?
- How often did losing streaks occur?
- How much capital would have been required?
These insights help traders understand the strengths and weaknesses of a strategy before applying it in live markets.
Example of a Simple Backtest
Imagine testing a moving average crossover strategy on ten years of historical data for a broad-market ETF.
The results might show:
- Total number of trades
- Winning percentage
- Average gain
- Average loss
- Maximum drawdown
- Annualized return
These statistics provide a clearer picture than relying on a handful of recent trades.
Limitations of Backtesting
Although backtesting is valuable, it has important limitations.
1. Past Performance Does Not Guarantee Future Results
Markets evolve because of economic conditions, regulations, technology, and investor behavior.
A strategy that worked well five years ago may not perform similarly in the future.
2. Overfitting
One of the most common mistakes is optimizing a strategy until it perfectly matches historical data.
This often creates a model that performs exceptionally in the past but poorly in live trading.
3. Ignoring Trading Costs
A realistic backtest should account for:
- Brokerage commissions
- Bid-ask spreads
- Slippage
- Taxes (where applicable)
Ignoring these costs can make a strategy appear more profitable than it actually is.
4. Survivorship Bias
Using only companies that exist today can distort historical results because it excludes businesses that failed or were delisted.
Professional backtesting uses datasets designed to minimize this bias.
Understanding Risk Management
Finding a profitable trading strategy is only part of the equation.
Protecting your capital is equally important.
Many experienced traders believe that risk management determines long-term survival, even more than entry signals.
Position Sizing
Avoid risking a large portion of your portfolio on a single trade.
Many disciplined traders limit their risk to a small percentage of their capital per position.
The appropriate risk level depends on your financial situation, investment objectives, and tolerance for volatility.
Diversification
Avoid concentrating your investments in a single stock, sector, or asset class.
Diversification can help reduce the impact of any one investment performing poorly.
However, diversification does not eliminate market risk.
Read detailed information about Best Long Term Dividend Stocks
Stop-Loss Rules
A stop-loss is a predefined exit point designed to limit potential losses.
Examples include:
- Percentage-based stop-loss
- Volatility-based stop-loss
- Moving average exit
- Trailing stop
Different strategies require different exit methods, so there is no universally “best” approach.
Maximum Drawdown
Drawdown measures the decline from a portfolio’s highest value to its lowest point before recovering.
Understanding drawdown helps investors evaluate whether they can tolerate the potential losses associated with a strategy.
A system with attractive returns but extremely large drawdowns may not suit every investor.
Risk-to-Reward Ratio
Before entering a trade, many traders compare the potential upside with the potential downside.
For example:
- Potential gain: $300
- Potential loss: $100
This represents a 3:1 risk-to-reward ratio.
While a favorable ratio can improve long-term expectations, it does not guarantee success on any individual trade.
Things to Check Before Using Any Quantitative Strategy
Before committing real money to a quantitative trading strategy, take time to evaluate it carefully.
Use this checklist:
| Checklist Item | Why It Matters |
|---|---|
| Has the strategy been backtested? | Confirms historical behavior, not future certainty |
| Is the logic easy to explain? | Simple strategies are often easier to maintain |
| Are transaction costs included? | Prevents unrealistic expectations |
| Is risk management clearly defined? | Helps protect capital |
| Has the strategy been paper traded? | Allows testing without financial risk |
| Does it fit your investment goals? | Ensures the strategy aligns with your objectives |
| Can you follow the rules consistently? | Discipline is essential for systematic trading |
Author Insight
One of the biggest misconceptions about quantitative trading is that it is a shortcut to easy profits.
In reality, successful quantitative investing is built on research, discipline, testing, and continuous improvement.
Many beginners spend too much time searching for the “perfect” indicator or algorithm. Experienced traders, however, understand that no system wins all the time. Instead, they focus on managing risk, following a repeatable process, and evaluating performance objectively over the long term.
If you’re just starting, resist the temptation to build complex artificial intelligence models. Begin with simple rule-based strategies, learn how markets behave under different conditions, and gradually expand your skills. A solid foundation is far more valuable than an overly complicated strategy that you don’t fully understand.
Read more about How to Avoid Losses in Stock Market
Frequently Asked Questions (FAQs)
1. What is quantitative trading?
Quantitative trading is a data-driven approach to buying and selling financial assets using predefined mathematical rules, statistical analysis, and computer algorithms. Instead of relying on emotions or intuition, traders make decisions based on objective data.
2. Is quantitative trading suitable for beginners?
Yes. Beginners can start by learning simple rule-based strategies such as moving average crossovers or momentum investing. While advanced quantitative trading often involves programming and statistics, the core concepts can be understood without extensive technical knowledge.
3. Do I need to know programming to become a quantitative trader?
Not necessarily. You can begin by understanding trading concepts, technical indicators, and risk management using spreadsheet software like Excel. However, learning a programming language such as Python can significantly expand your ability to develop, test, and automate trading strategies.
4. What markets can quantitative trading be used in?
Quantitative trading can be applied to various financial markets, including:
- Stocks
- ETFs
- Index funds
- Forex
- Commodities
- Futures
- Options
- Cryptocurrencies
The effectiveness of a strategy depends on market conditions, data quality, liquidity, and transaction costs.
5. What is backtesting?
Backtesting is the process of evaluating how a trading strategy would have performed using historical market data. It helps traders identify strengths and weaknesses before risking real money.
However, backtesting has limitations because historical performance does not guarantee future results.
6. Is quantitative trading profitable?
It can be, but there are no guarantees. Profitability depends on factors such as the quality of the strategy, risk management, execution, market conditions, and ongoing monitoring.
Even successful strategies experience losing periods.
7. What is the biggest risk in quantitative trading?
One of the most significant risks is relying too heavily on historical data. A strategy that performed well in the past may fail when market conditions change.
Other risks include poor data quality, software errors, overfitting, and inadequate risk management.
8. What programming language is best for quantitative trading?
Python is widely regarded as the most popular programming language for quantitative trading because it is beginner-friendly, versatile, and supported by numerous financial analysis libraries.
9. Can quantitative trading be fully automated?
Yes. Many traders automate data collection, signal generation, order execution, and portfolio monitoring using trading platforms and brokerage APIs.
However, automated systems still require regular supervision, testing, and updates to adapt to changing market conditions.
10. How should beginners start learning quantitative trading?
A practical learning path is:
- Learn stock market basics.
- Understand technical indicators.
- Study statistics and probability.
- Learn basic Python programming.
- Practice backtesting with historical data.
- Paper trade before investing real money.
- Continue reviewing and refining your strategies.
Taking a gradual, disciplined approach is generally more sustainable than trying to master advanced algorithms immediately.
For detailed information abut Mutual Funds vs Stocks: Which Is Better for Long-Term Wealth
Key Takeaways
- Quantitative trading uses mathematical models and data analysis to identify trading opportunities.
- Decisions are based on predefined rules rather than emotions.
- Programming knowledge can be helpful but is not essential when learning the fundamentals.
- Backtesting helps evaluate how a strategy would have performed using historical data.
- Risk management is just as important as finding profitable trading signals.
- Beginners should start with simple strategies before exploring more advanced techniques.
- Market conditions change over time, so no strategy works in every environment.
Conclusion
Quantitative trading combines finance, mathematics, statistics, and technology to create systematic approaches for identifying trading opportunities. While it may seem intimidating at first, the underlying principles are accessible to anyone willing to learn step by step.
For beginners, the goal should not be to build complex algorithms overnight. Instead, focus on understanding how markets behave, why trading rules are created, and how risk management protects capital. Simple strategies—such as moving average crossovers, momentum investing, and trend following—provide an excellent starting point for developing disciplined trading habits.
It’s equally important to recognize that no quantitative strategy is foolproof. Markets evolve, economic conditions change, and even the best-performing systems experience periods of underperformance. Continuous learning, regular backtesting, realistic expectations, and prudent risk management are essential for long-term success.
Whether you eventually automate your trading or simply use quantitative techniques to support your investment decisions, developing a structured, evidence-based approach can help you become a more informed and disciplined investor.
You can read also about How to Analyze Stocks Before Investing
External sources to write this article:
- Official educational resources from the U.S. Securities and Exchange Commission
- Investor education materials from the FINRA
- Market data and methodology from the Nasdaq
- Economic data published by the Federal Reserve
- Official documentation for Python financial libraries and backtesting frameworks
Author’s Note: I’ve been actively investing in mutual funds and the stock market since 2018. Over the years, I’ve gained practical experience in long-term investing, portfolio building, and personal finance. While I’m not a licensed financial advisor, I create educational content based on my investing experience, extensive research, and trusted financial sources. The information shared in this article is intended for educational purposes only and should not be considered personalized financial advice.
Disclaimer: The content provided is for educational and informational purposes only and should not be considered financial, investment, insurance, or legal advice.